HUD Stats
The HUD (Heads-Up Display) stats panel simulates one million hands from the solved strategy and computes standard poker statistics for each position. These are the same stats you would see in a poker tracking program like PokerTracker or Hold'em Manager, but derived from the GTO solution rather than from actual play.
HUD stats are useful for quickly understanding the overall character of the GTO strategy at each position - how aggressive, how loose, how often players see showdown.
Generating HUD Stats
After running a solve, expand the HUD Stats section in the left panel and click Generate HUD Stats. The solver simulates 1,000,000 hands using the solved strategy and computes the statistics. This takes a few seconds.
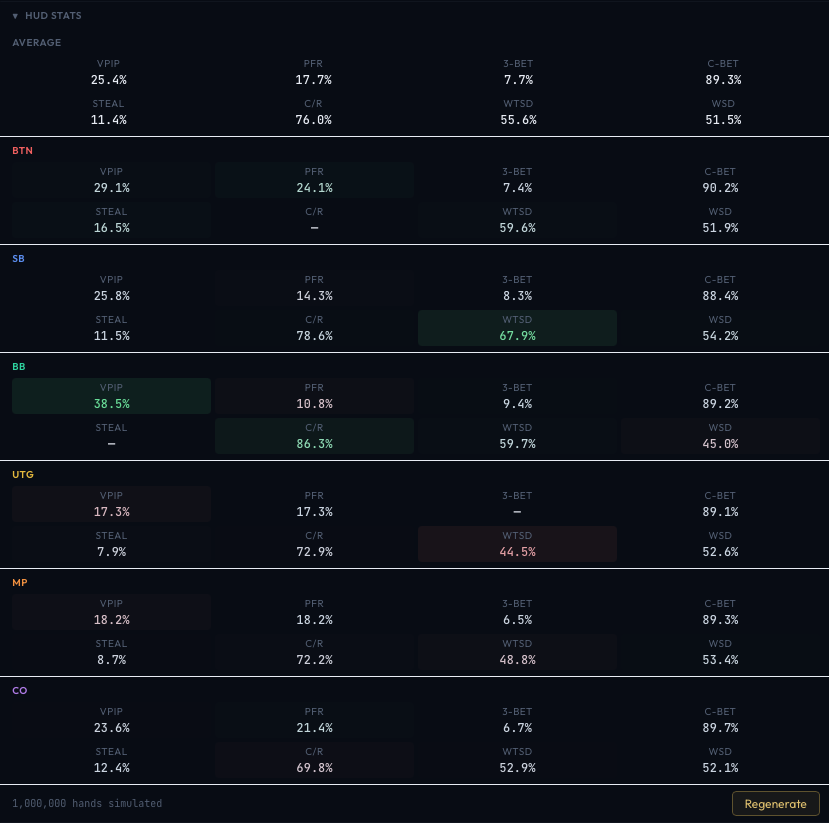
Once generated, the stats appear in a table with a row for each player position and an Average row at the top.
Stat Definitions
VPIP - Voluntarily Put In Pot
The percentage of hands where the player voluntarily puts chips in the pot preflop (by calling or raising). Posting blinds does not count.
Example: If the BTN open-raises 40% of hands and folds the rest, the BTN's VPIP is 40%.
Higher VPIP means a looser player who plays more hands. In a GTO solution, VPIP increases for positions with better table position (the button will typically have the highest VPIP).
PFR - Pre-Flop Raise
The percentage of hands where the player raises preflop. This includes open-raises, 3-bets, 4-bets, and any other preflop raise.
Example: A player who open-raises 25% of the time and 3-bets another 5% has a PFR of 30%.
PFR is always equal to or less than VPIP (since raising is a subset of voluntarily putting in chips). A large gap between VPIP and PFR indicates lots of cold-calling.
3-BET
The percentage of opportunities where the player re-raises when facing an open-raise. Measured as: (times 3-bet) / (times faced an open-raise).
Example: If a player faces 100 open-raises and re-raises 8 times, their 3-bet stat is 8%.
C-BET - Continuation Bet
The percentage of times the preflop raiser bets on the flop. Measured as: (flop bets after raising preflop) / (flops seen after raising preflop).
Example: A player raises preflop, sees the flop, and bets 65% of the time. Their C-BET is 65%.
This stat is only meaningful for preflop aggressors. A high C-BET means the player follows through on their preflop aggression on most flop textures.
STEAL
The percentage of hands where the player raises when folded to in late position and everyone subsequently folds. This measures how aggressively positions exploit fold equity.
Example: On the button, folded to - the player raises and both blinds fold. This counts as a successful steal.
C/R - Check-Raise
The percentage of times the player checks and then raises when an opponent bets. Measured as: (check-raises) / (opportunities to check-raise).
Example: A player in the big blind checks, the preflop raiser bets, and the BB raises. That is a check-raise.
WTSD - Went to Showdown
The percentage of hands that go to showdown, given the player saw the flop. Measured as: (hands reaching showdown) / (hands where this player saw the flop).
Example: If a player sees 200 flops and 60 of those hands reach showdown, WTSD is 30%.
A high WTSD suggests the player (or the overall game dynamic) has a lot of calls through to the river. A low WTSD means hands are frequently resolved by folds before showdown.
WSD - Won at Showdown
The percentage of showdowns won. Measured as: (showdowns won) / (showdowns reached).
Example: Out of 60 showdowns, the player wins 35. WSD is 58.3%.
WSD above 50% means the player wins more showdowns than they lose, which generally correlates with tighter showdown ranges.
Reading the HUD Display
Average Row
The top row shows the average across all positions. This gives a baseline for the overall strategy profile.
Per-Position Rows
Each position (BTN, SB, BB, UTG, etc.) has its own row. Position names are color-coded to match the poker table display.
Color Coding
Individual stat values are color-coded relative to the average:
- Green tint - Above average. The color intensity increases with the deviation.
- Red tint - Below average. Again, intensity increases with larger deviations.
- Neutral (no tint) - Close to average.
This makes it easy to spot which positions deviate most from the norm. For example, the BTN typically has an above-average VPIP and PFR (green) while the BB might have an above-average WTSD.
Hands Simulated
At the bottom, the panel shows the total number of hands simulated (1,000,000 by default). You can click Regenerate to run the simulation again - the results may vary very slightly due to Monte Carlo sampling, but should be consistent for well-converged solves.
Practical Uses
- Comparing positions: See which positions are most and least profitable in the GTO solution. Useful for understanding positional advantages.
- Studying aggression profiles: Compare PFR, 3-BET, and C-BET across positions to understand how GTO distributes aggression.
- Validating your play: Compare your actual HUD stats from a tracking program against the GTO stats to identify leaks. If your VPIP is much higher than GTO from UTG, you are likely playing too many hands from early position.
- Understanding check-raise frequency: The C/R stat reveals how often GTO check-raises at various positions - a key defensive metric, especially from the blinds.