Stats and Session History
IkaSolver tracks your training performance in real time during each session and stores completed sessions for long-term analysis. This page covers the live stats panel and the session history modal.
Live Session Stats
The stats panel appears at the bottom of the trainer's main area during an active session. It updates in real time as you play hands.
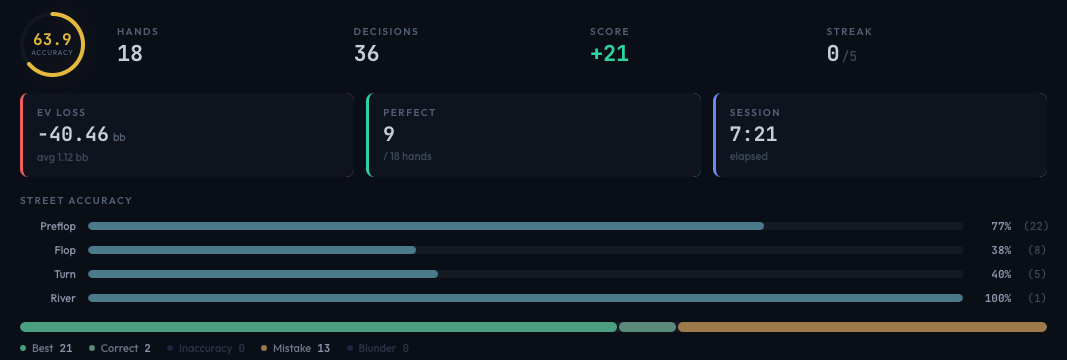
Accuracy Ring
The circular ring on the left shows your overall accuracy as a percentage. Accuracy is the proportion of decisions graded as "Best Move" or "Correct" out of all decisions made this session.
The ring color changes based on your accuracy:
- Green (70%+) - You're playing well
- Yellow (50 - 69%) - Room for improvement
- Red (below 50%) - Significant leaks to address
Quick Metrics
Next to the accuracy ring, four key numbers are displayed:
- Hands - Total hands completed this session
- Decisions - Total decision points where you acted
- Score - A cumulative score that rewards good play and penalizes mistakes. You earn +1 for each "Best Move" decision. Blunders subtract points proportional to their EV cost.
- Streak - Current consecutive correct decisions, shown as "current/best" (e.g., "7/12" means your current streak is 7 and your session record is 12). Streaks of 5+ glow teal; streaks of 10+ glow bright green.
EV Loss, Perfect Hands, and Session Timer
Below the quick metrics, three stat cards show:
- EV Loss - Total expected value lost due to suboptimal play, measured in big blinds (bb). The subtext shows the average EV loss per decision. Lower is better - an average of 0.00 bb means you're playing perfectly.
- Perfect - How many hands you played without any errors (every decision was "Best Move" or "Correct"), shown as a fraction of total hands (e.g., "8 / 15 hands").
- Session - A running timer showing how long the current session has been active. Freezes when you stop training.
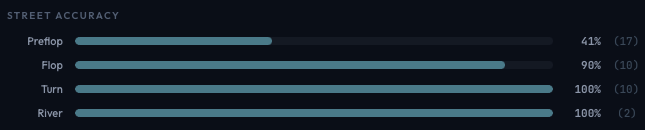
Per-Street Accuracy Bars
Once you've played decisions on multiple streets, horizontal bars appear showing your accuracy by street (Preflop, Flop, Turn, River). Each bar shows the accuracy percentage and the number of decisions in parentheses. This helps you spot which streets need the most work - many players are strong preflop but leak significantly on the river.
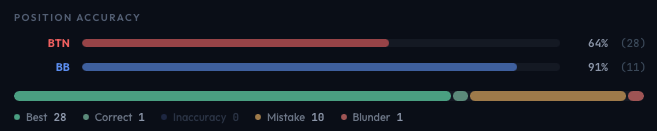
Per-Position Accuracy Bars
If you've played hands from multiple positions during the session, bars appear showing your accuracy by position (BTN, SB, BB, etc.). Each bar is color-coded to its position and shows accuracy and decision count. Useful for identifying positional leaks - for example, if your BB defense accuracy is much lower than your BTN play.
Quality Breakdown Bar
At the bottom, a segmented bar shows the distribution of your decision grades across all five severity levels (Best, Correct, Inaccuracy, Mistake, Blunder). The bar gives a visual sense of where your errors concentrate. Below it, each grade is listed with its count.
Session History
Click the Stats button in the hand history panel header to open the session history modal. This modal stores all your completed training sessions (saved when you click Stop) and provides all-time analysis.
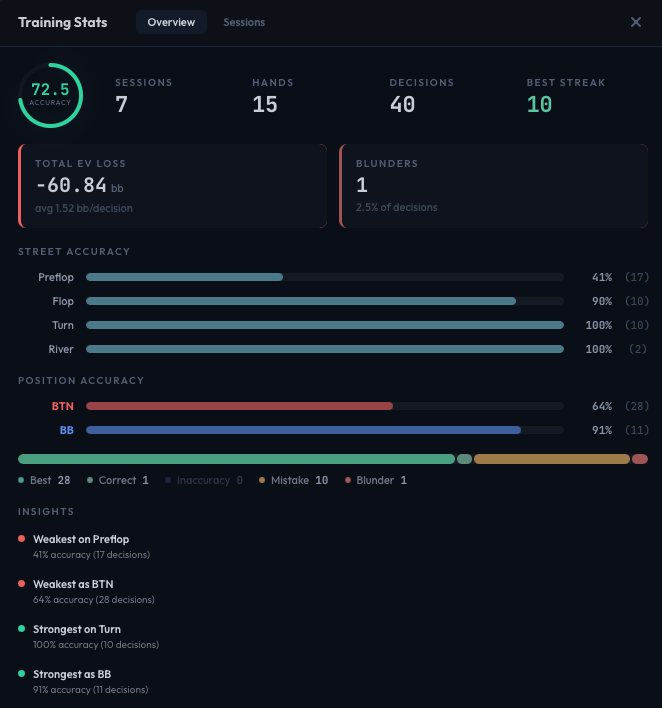
Overview Tab
The Overview tab aggregates statistics across every training session you've ever completed:
- Accuracy ring - All-time accuracy percentage
- Sessions / Hands / Decisions / Best Streak - Lifetime totals
- Total EV Loss - Cumulative EV lost across all sessions, with per-decision average
- Blunders - Total blunder count and what percentage of decisions they represent
- Street accuracy bars - Lifetime accuracy broken down by street
- Position accuracy bars - Lifetime accuracy broken down by position
- Quality breakdown - All-time distribution of decision grades
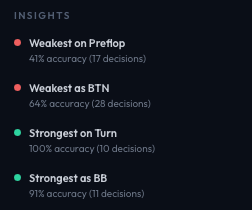
Insights Panel
Below the all-time stats, an Insights panel highlights your notable strengths and weaknesses based on your historical data. Insights are auto-generated and might include observations like:
- "Strong preflop play - 89% accuracy across 342 decisions" (strength, shown with a green dot)
- "River decisions need work - 51% accuracy, below your average" (weakness, shown with a red dot)
These insights update as you accumulate more data and can help guide what you focus on in future training sessions.
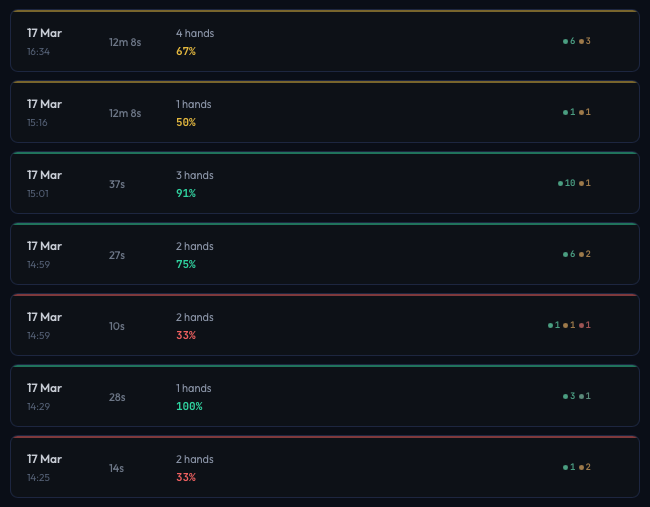
Sessions Tab
The Sessions tab lists all completed sessions in reverse chronological order. Each session card shows:
- Date and time the session started
- Duration (e.g., "12m 34s")
- Hand count and accuracy percentage (color-coded green/yellow/red)
- Quality dots - small colored dots with counts for each severity level
Click a session card to drill down into that session's details.
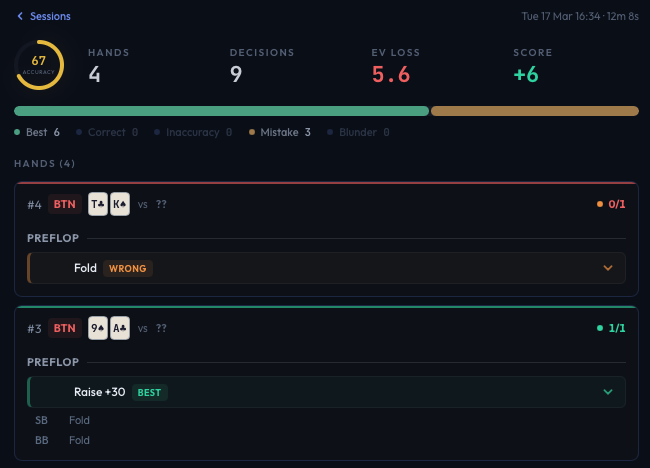
Session Detail View
The drill-down view for a single session shows:
- Accuracy ring for that specific session
- Hands / Decisions / EV Loss / Score metrics
- Quality breakdown bar
- Hand list - Every hand from the session with its hole cards, position, and decision grades
Each hand in the list shows the same compact format as the hand history panel. You can delete individual hands from a session if you want to exclude outliers (e.g., a misclick) from your stats.
To return to the session list, click the Sessions back link at the top.
Deleting Sessions
Hover over a session card and click the X button to delete it. A confirmation prompt appears to prevent accidental deletion. Deleting a session removes it from your all-time statistics.
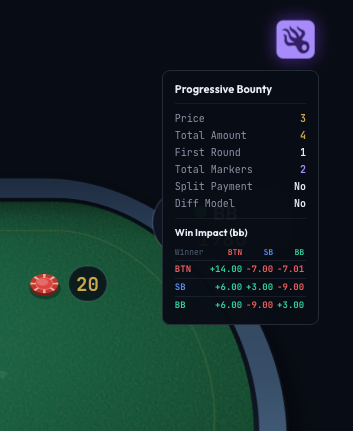
Bounty Info Tooltip
When training on a bounty tree, a squid icon appears in the top-right corner of the trainer table. Hover over it to see the current bounty configuration and win impact matrix, showing the EV impact in big blinds for each player elimination.